
Was there voter fraud in the 2021 Peru Presidential Elections?
Abstract
This paper performs a forensic study of the Peru’s presidential election on June 6th, 2021 between Pedro Castillo and Keiko Fujimori, where ex-candidate Keiko Fujimori claimed there had been irregularities. We calculate three p-values that help us determine if there was fraud. The consensus of the results indicates that there was no manipulation of the results.
Author Contributions
Academic Editor: Åžafak Taktak, Psychiatry Department Ahi Evran University Education and Research Hospita, Turkey.
Checked for plagiarism: Yes
Review by: Single-blind
Copyright © 2021 Raúl Isea, et al.
 This is an open-access article distributed under the terms of the Creative Commons Attribution License, which permits unrestricted use, distribution, and reproduction in any medium, provided the original author and source are credited.
Competing interests
The authors have declared that no competing interests exist.
Citation:
Introduction
On April 11th, 2021 the first round presidential election was held with 24 political parties, where it was projected as potential winners the Peru Libre candidate Pedro Castillo and the Fuerza Popular candidate Keiko Fujimori with 2,724,752 and 1,930,762 votes, respectively. The second round was held on June 6th, 2021, where Pedro Castillo was chosen as winner with 8,835,579 votes against the 8,791,521 obtained by Fujimori. As a matter of fact, the National Office of Electoral Processes (known as ONPE, by Spanish initials) declared that there was 17,620,000 valid votes, 121,477 blank votes and 25.43% of abstention (details in ONPE, https://www.resultadossep.eleccionesgenerales2021.pe/SEP2021/).
However, on June 8th the right-wing conservative candidate Keiko Fujimori denounced there had been irregularities in favor of Pedro Castillo1, and even claimed that the elections had to be held again2 Nevertheless, Keiko Fujimori recognized the victory of her opponent on July 26th , and finally the ONPE declared as winner to Pedro Castillo.
For this reason, we performed a study based on statistical techniques according to the Benford’s Law3 to determine if there actually was any manipulation in results. This methodology has been employed in some many studies3, 4, 5, 6, 7. Moreover, this law has even been used in presidential elections as explained by Mebane8 and Deckert et al9 as explained in the next section.
Methodology
The forensic analysis was performed with the same computational methodology employed both in the Covid-19 registered cases study6, and in the recent US elections held in 20207. This methodology is based in the Benford’s Law, and we determine three critical values.
The p-value(χ2), p-value(Man) and p-value(FW), refer collectively to as p-values, were calculated in the following way6, 7. The first value [ p-value(χ2) ] comes from the occurrence frequency of first digit of the data (left to right), which is based on the Benford’s Law of the first digit, and the probability should follow the following mathematical relation10:
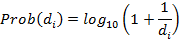
Where i goes from 1 to 9 (excluding zero). With these probabilities, the Pearson value (χ2) is calculated to detect discrepancies in data, which is given by:
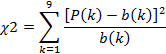
where P(k) and b(k) are the distributions obtained from the votes and the expected from Benford’s Law, respectively. Thanks to this value, it was possible to determine the p-value(χ2) which indicates us whenever data is correct, as long as it is greater than or equal to 0.056, 7.
The next value, p-value(Man), employs the Mantissa Arc test, and to do so we must find the mass center of data according to the following mathematical relation10:
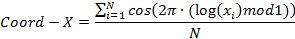
where the xi are the votes to validate, and N is the total number of them. We then calculated the L2 term given by:

where L2 should be almost zero, it means, while greater than zero, it is possible to suspect a manipulation of the elections.
So the p-value(Man) equals to:
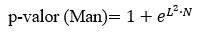
Finally, the p-value (FW) is known as the Freedman-Watson test (FW), designed to compare discrete distributions based on the following mathematical relation11:
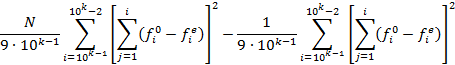
However, it is recommended to check Freedman’s original paper11to know every mathematical detail of this last equation.
So, there would be no suspicion of manipulation of the election, if any of the p-values is greater than or equal to 0.05. Nevertheless, if all three values are less than 0.05, it is a sign of inconsistency or fraud6, 7.
Finally, we want to validate this methodology according to the total number of voters inscribed in twenty five Peru states according the ONPE data, i.e. in the states of Amazonas, Ancash, Apurimac, Arequipa, Ayacucho, Cajamarca, Callao, Cusco, Huancavelica, Huanuco, Ica, Junin, La Libertad, Lambayeque, Lima, Loreto, Madre de Dios, Moquegua, Pasco, Piura, Puno, San Martin, Tacna, Tumbes, and Ucayal. Finally we analyzed the second round election results grouped by political party.
Results
In Table 1 we present all the data collected for the study according to the ONPE results. In this table we can observe that Pedro Castillo loss in six of twenty five states (ie., Callao, La Libertad, Lambayeque, Lima, Piura, and Tumbes). In the Loreto state, for instance, Castillo won only for 5,350 votes (which represent about 1.46% of the electoral roll), and in the Ica state while the votes difference was a little higher (5626 votes ahead for Castillo), this difference is only 1.09% of the electoral register in this last state. In contrast, there were some states where the difference was way higher, such as Puno: where Castillo won over with more than 580 thousand votes (a difference of almost 75% of the electoral roll).The most favorable state for Fujimori was Lima, where she outnumbered Castillo by almost two million votes, which only represent 27,67% of difference in between them.
We show the p-values for the total of all registered votes in the electoral roll of Peru in the Table 2, and also the analysis of the votes obtained by Pedro Castillo and Keiko Fujimori, respectively. As we can see in this table, there’s no evidence of data manipulation as the all surpass the threshold value of 0.05. Furthermore, the L2value must be close to zero and there are also similarities between all of them (see Table 2)
Table 1. Peru’s states where is indicated the number of electors for each state, and the votes obtained for Pedro Castillo and Keiko Fujimori.| State | Total voters | Votes for Pedro Castillo | Votes for Keiko Fujimori |
| Amazonas | 161,890 | 98,716 | 52,913 |
| Ancash | 597,055 | 314,394 | 233,325 |
| Apurimac | 209,560 | 160,943 | 36,737 |
| Arequipa | 900,759 | 549,681 | 299,759 |
| Ayacucho | 287,140 | 223,383 | 49,130 |
| Cajamarca | 690,285 | 456,128 | 190,041 |
| Callao | 642,766 | 195,098 | 403,813 |
| Cusco | 718,117 | 561,406 | 116,299 |
| Huancavelica | 174,567 | 139,498 | 26,243 |
| Huanuco | 367,857 | 229,059 | 114,648 |
| Ica | 515,652 | 231,546 | 225,920 |
| Junin | 693,301 | 377,083 | 271,117 |
| La Libertad | 1,022,886 | 376,424 | 570,558 |
| Lambayeque | 711,954 | 274,662 | 387,053 |
| Lima | 6,418,172 | 2,127,809 | 3,903,451 |
| Loreto | 366,268 | 176,864 | 171,514 |
| Madre de Dios | 76,770 | 50,244 | 20,533 |
| Moquegua | 114,448 | 78,009 | 28,926 |
| Pasco | 130,700 | 80,358 | 42,140 |
| Piura | 996,743 | 363,786 | 560,618 |
| Puno | 733,093 | 624,592 | 76,280 |
| San Martin | 430,319 | 222,029 | 177,108 |
| Tacna | 219,577 | 150,672 | 57,187 |
| Tumbes | 131,348 | 41,464 | 80,064 |
| Ucayali | 258,435 | 115,356 | 126,116 |
| Total votes of the electoral register | Votes obtained for Pedro Castillo | Votes obtained for Keiko Fujimori | |
| p-Valor(χ2) | 0,19 | 0,97 | 0,53 |
| p-Valor(Man) | 0,21 | 0,44 | 0,22 |
| L2 | 0,06 | 0,03 | 0,06 |
| p-Valor(FW) | 0,19 | 0,88 | 0,44 |
Conclusion
This paper determined a forensic analysis of the Peru’s presidential elections on June 6, 2021. We determined three p-values that can help us determine if there have been manipulations of the results. The results indicated that there is no fraud. Moreover, we show how valid is the methodology when we analyzed the electoral register in twenty five states, and therefore, we concluded that there was no fraud in Peru election.
References
- 1.J D Quesada, Fowks L. (2021) Keiko Fujimori alleges fraud as Peru election goes down to the wire.El País.https://emglish.elpais.com/usa/2021-06-08/keiko-fujimori-alleges-fraud-as-peruelection-goes-down-to-the-wire.html.
- 2.AFP. (2021) Presidential hopeful Fujimori repeats Peru vote fraud claims.France 24. https://www.france24.com/en/live-news/20210617-presidential-hopeful-fujimori-repeats-peruvote-fraud-claims.
- 3.Nigrini Mark. (1996) . , A Taxpayer Compliance Application of Benford’s Law.Journal of the American Taxation Association 18, 72-91.
- 4.Pietronero E, Tossati E, Tossati V, Vespignani A. (2001) Explaining the uneven distribution of numbers in Nature: The Laws of Benford and Zipf,PhysicaA. 293, 297-304.
- 5.Zhipeng L, Ling C, Huajia W. (2004) . Discussion on Benford’s Law and its Applications.arXiv. http://arxiv.org/abs/math/0408057 .
- 6.Isea R. (2020) How valid are the reported cases of people infected with Covid-19 in the worlds?. , International Journal of Coronavirus 1(2), 53-57.
- 7.Isea R. (2021) Hubo fraude electoral en las elecciones presidenciales de los Estados Unidos en 2020? To be published at Revista Electrónica CLIC.
- 8.Mebane W. (2008) Election forensics: The second-digit Benford’s law test and recent American presidential elections. En el libro: Alvarez RM, Hall TE, Hyde SD, editors. Election Fraud: Detecting and Deterring Electoral Manipulation.
- 9.Deckert J, Myagkov M, P C Ordeshook. (2011) Benford’s Law and the detection of election fraud.PoliticalAnalysis. 19, 245-268.